
Review of upstream Petrochemical Occupational Exposure and Risk Personnel and Ambient Sampling
Marco Pedone,1 Francesca Lucaroni,2 Antonio Bergamaschi,3 Nicholas Tidei,3 Federico Renzetti,3 Damiano Toni,3 Cinzia Fulvi,3 Laura Morciano,2 Danilo De Angelis3
1 Columbia University, Mailman School of Public Health
2 University of Rome Tor Vergata, Department of Biomedicine and Prevention
3 Phoenix Environment Sustainable Development srl
Introduction
This study is performed on Upstream oil production facility located in Italy.
This facility collects petroleum product fluid extracted from different wells. The extracted product is aggregated at the Oil center via a pipeline transfer system and then this crude fluid undergoes a stabilisation and treatment process. During this process, the petroleum product consisting of primarily crude, water, and sulfur is treated so that ground water and sulfur can be separated to different components before it can be commercialised.
This evaluation and assessment was performed with the intent to achieve two goals. The first was to review industrial hygiene exposure data collected during time period of February 2016 to June 2018. The reviewed data consisted of three distinct industrial hygiene studies with data sets for both personnel and area monitoring via air sampling. The second goal is to add to the body of literature on exposure levels to employees working at upstream petroleum production facilities, since currently there is not a large body of data on the subject.
The diagram below (Figure 1) shows the different areas of the Oil and Gas plant, which are subdivided based on operational activities. Since each of the areas poses different potential occupational hazards, the sampling plan took this into account. As the sampling plan was created and implemented, the team worked to sample the different areas of the plant in an effort to capture differences in exposure levels.
Map of Oil and Gas center broken up by area
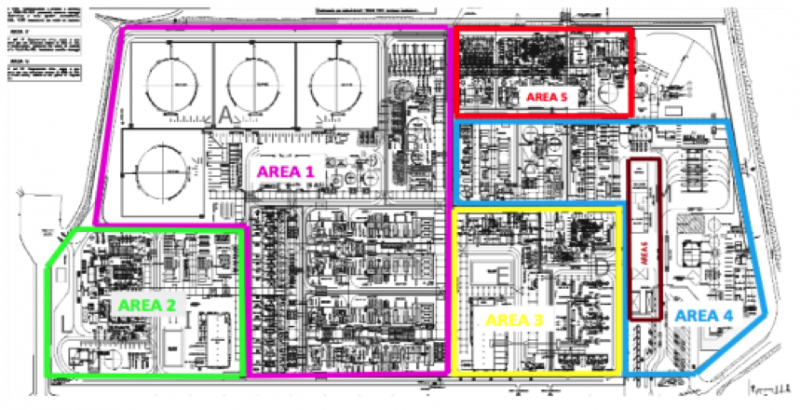
The areas of the plant are characterised as:
- Oil and water storage, separation and stabilization.
- Transformation of sulfated compounds into liquid.
- Electricity and steam production.
- Sulfuric acid storage for regeneration.
- Water softening, treatment and separation of oil, water and gas.
- Offices and control room.
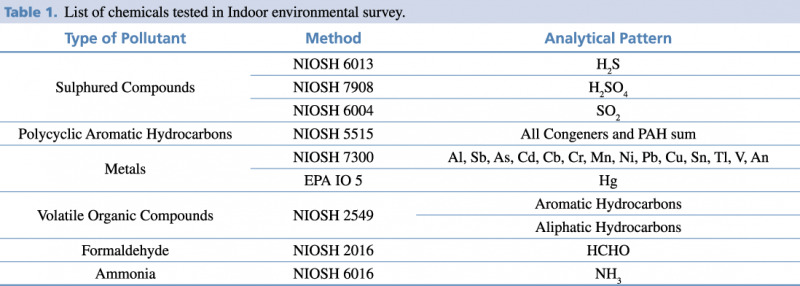
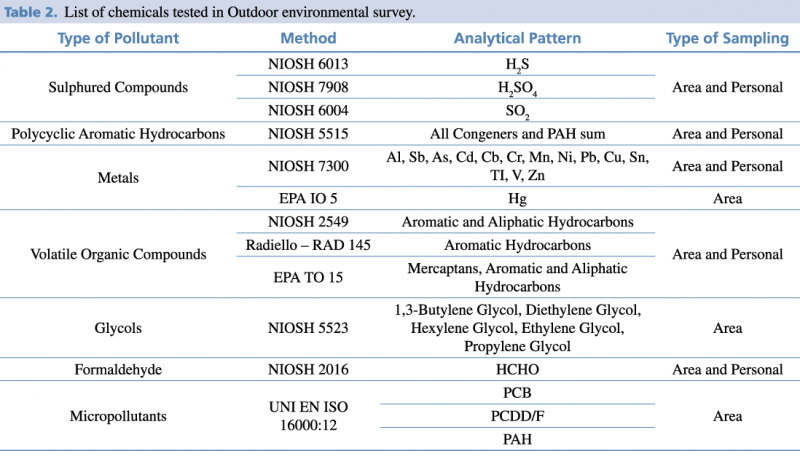
Currently, there are initial results available for the sampling completed by the Italian Industrial Hygiene Company at the Oil and Gas plant for three separate studies. The first study was conducted in February of 2016 and involved area sampling for 53 chemicals.1 In total, 23,000 sample data points were collected during the 30-day sampling period. Table 1 presents the type of pollutants sampled in addition to the methods used. The second study was completed between December 2016 and March 2017 and included both area and personal sampling.2 Overall, 131 chemicals were monitored and 27,327 samples were collected. Table 2 presents the type of pollutants sampled along with the methods used.3 In the third study, 143 chemicals were sampled in early 2018. The chemicals were categorized into the following groups: aromatic hydrocarbons, sulfur compounds, other VOCs, odorants, metals, glycols, alcohols, powders, CFC, other VICs, amines, IPA, PCBs, and PCDD/F. The third study was a continuation of the initial two studies and was designed to expand on the chemicals tested previously. The third study encompassed a greater diversity of plant areas and sampling times that more closely tied with integrals of personnel shifts at the plant.4
List of chemicals tested in Indoor environmental survey.
List of chemicals tested in Outdoor environmental survey.
Methods
To examine the sampling results, we compared data on each of the maximum values for the different chemicals that were sampled in the three different studies to threshold limit values (TLVs) established by the American Conference of Governmental Industrial Hygienists.5,6 For the chemicals where there were defined TLVs, there were no exceedances of TLVs. However, there were many chemicals without a defined TLV, so those could not be compared to the occupational exposure level. The Industrial Hygienist team carried out all of the sampling for the chemicals in the three studies. Our analysis operates under the assumption that the Italian Industrial Hygiene Company team used validated, appropriate, and up to date sampling methods from NIOSH or other comparable regulatory agencies, and that they carried out all of the sampling in strict accordance to the methods.
We also conducted a literature review to identify additional publications on exposure levels for employees working at upstream petroleum plants. There were a few studies that focused on various health outcomes associated with occupational exposures, but we did not find a large number of studies that reported exposure levels. There was one comprehensive study by Verma et al. from 2000 titled Benzene and Total Hydrocarbon Exposure in the Upstream Petroleum Oil and Gas Industry, and we will use this study and their findings as a benchmark and guide to analyse the Oil and Gas center sampling results. Verma et al. focused on benzene and hydrocarbons, reporting maximum values for these chemicals and the percentages of their samples that exceeded occupational exposure limits.7
Results
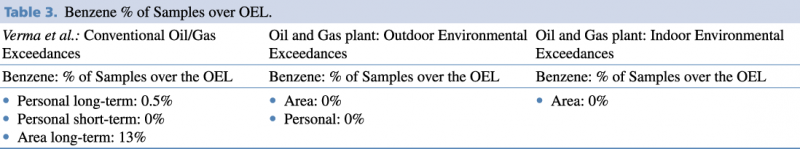
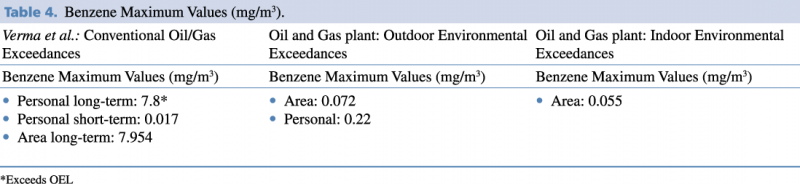
We compared the Verma et al. paper to the two surveys at the Oil and Gas center for benzene (Table 3). Specifically, we were interested in determining the percentage of benzene samples over the occupational exposure limit (OEL) of 3.2 mg/m3 or 1 ppm. Personal samples for the Verma et al. study found 0.5% of samples over the OEL and 13% of area samples over the OEL. We also compared the Benzene maximum values from the Verma et al. study to the first two Oil and Gas center (Table 4). The maximum values for personal long-term samples were 7.78 mg/m3 and the maximum value for area samples was 7.9 mg/m3. Both of these values are above the occupational exposure limit for benzene. For the indoor and outdoor surveys at the Oil and Gas center plant, neither the outdoor area maximum value of 0.072 mg/m3 nor the personal maximum value of 0.22 mg/m3 were over the OEL. Similarly, the indoor area maximum value of 0.055 mg/m3 was below the OEL.
Benzene % of Samples over OEL
Next, we sought to compare the total petrochemical hydrocarbons from the Verma et al. study with the initial two surveys conducted at the Oil and Gas plant. However, in the first two studies the Industrial Hygienist team did not monitor all the chemicals that are commonly utilized to determine ‘total petrochemical hydrocarbons’ (THP). These chemicals include the following: acetone, benzene, ethyl alcohol, ethylbenzene, isopropyl alcohol, n-hexane, methyl n-amyl ketone, methylene chloride, methyl ethyl ketone, methyl isobutyl ketone, tetrachloroethylene, toluene, 1,1,1-trichloroethane, trichloroethylene, total trimethylbenzenes and total xylenes.8 Complete sampling for all of these chemicals would need to be addressed in future studies to ensure a direct comparison can be made between the Verma et al. study in Canada and the work completed in Italy at the Oil and Gas plant. Since we could only account for about 7 chemicals on the TPH list, we chose instead to look at total volatile organic compounds (VOCs) for our analysis.
Total VOCs analysis may have an even greater impact on understanding the air quality at the plant, as the number of chemicals monitored is significantly higher than the list of 16 typical TPHs. The initial two surveys indicated no exceedances of established threshold limit values for individual VOCs. The total VOC values were calculated and compared to the Leadership in Energy and Environmental Design (LEED) indoor air quality assessment value for total VOCs for new construction projects of 0.5 mg/m3.9
The total VOC indoor maximum found in the Oil and Gas plant studies was 0.056 mg/m3, the total VOC outdoor maximum was 0.42 mg/m3, and the total VOC outdoor personal maximum was 0.61 mg/m3.
Both the indoor and outdoor maximums for total VOC were below the LEED requirement, and the total VOC outdoor personal maximum was slightly above the LEED requirement. However, since the LEED requirement is for indoor air quality, this recommendation is not directly applicable to the determined total VOC maximum for outdoor personal samples.
Benzene Maximum Values (mgm3)
Overall the three studies conducted at the Oil and Gas plant add to the body of data on occupational upstream petroleum facility exposure levels. They build on the Verma et al. study, testing and reporting on a much wider array of chemicals, and the Oil and Gas plant studies collected an enormous amount of individual sampling points.
Quality Control Analysis
Following these initial three surveys at the Oil and Gas plant, a quality control sampling process was initiated in May 2018 that lasted about a week. The purpose of the quality control sampling was to ensure sampling efforts followed NIIOSH or other comparable regulatory agency approved methods and to verify the quality of the original findings. The initial sampling procedures were reproduced at 7 points around the plant. This involved 5 active samples and 2 passive samples. The sampling locations for the quality control were largely selected based on the fact that they had been deemed among the most dangerous areas at the plant.
At this time, a full review on the quality control data is still underway. Preliminary analysis shows that on the whole the values reported in the quality control sampling were consistent with the three studies conducted in that these values were quite small and did not exceed established TLV thresholds where these thresholds exist.
Implications for Future Research
The review of the Oil and Gas plant studies has allowed us to identify an opportunity to enhance the initial exposure information by recommending the next steps for industrial hygiene and occupational exposure information by recommending the next steps for industrial hygiene and occupational exposure assessment. A cumulative assessment should be performed that groups the chemical substances identified at Oil and Gas plant into two groups. Group 1 would be chemicals that exhibit classic dose response curves and are non-carcinogenic. The other group, group 2, would be identified carcinogens. Chemicals in Group 1 should be further assessed and subdivided into chemicals published TLVs and those without, and then grouped by systemic toxicology class to allow for the calculation of a cumulative exposure. Control banding methods can then be applied to estimate and assign an exposure hazard category.
Group 2 chemicals, the carcinogens, could be analysed and evaluated using method applied in Chen et al.’s 2016 paper titled Excess Lifetime Cancer Risk Assessment of Volatile Organic Compounds Emitted from Petrochemical Industrial Complex. In this paper, the authors calculated excess lifetime cancer risk (ELCR) values due to exposure by inhalation of carcinogenic VOCs emitted from Lin-Yuan Petrochemical Industrial Complex in southern Taiwan. To calculate this ELCR, they multiplied the annual average concentration of each chemical of concern in ambient air by a unit risk value. A unit risk value as described by Chen et al. is the excess cancer risk associated with the inhalation of a concentration of 1 µg/m-3of a given carcinogen.10
An opportunity for additional research on the Oil and Gas plant would be to expand evaluation on carcinogenic VOCs of interest to be able to model the calculations by Chen et al. and create an ELCR list for the chemicals found at the Oil and Gas plant. The Oil and Gas plant ELCR list could be utilised to estimate expected cancer and illness rates necessary to clearly understand the current and predicted health status of the population surrounding the Oil and Gas plant.
Furthermore, exposure surveillance could be extended to other pollutants, using both widespread techniques and innovative tools, as for example LIDAR/DIAL systems,11 with the capability to identify the substances and to give maps of concentration in space and time.
Exposure data play a key role in monitoring risk for health at workplace and they could be effectively used in combination with epidemiological surveillance, yet too underutilized in workers’ health care management, in order to carry out a new integrative approach to assess occupational health.12
References
- Giusto F. Petrolio lucano; al Mise si ridiscutono: Art. 16, royalties e patto di stabilità. TRM network. (2013) [cited 2 October 2018]. Available from: http://www.trmtv.it/home/primo-piano/2013_10_19/59952.html.
- Industrial Hygiene Monitoring: Outdoor Workplaces. Val D’agri Oil Center Viggiano ENI S.p.A. (2017). Phoenix ESD s.r.l.
- Pedone M, Cappelletti MC, Pettinato C, Fulvi C, Toni D, Locke R, Farrel K, De Angelis D. Industrial Hygene Monitoring and Assessment in Upstream Oil Extraction and Treatment Facilities. Lecture presented at 35 Congresso Nazionale di Igiene Industriale e Ambientale in Italy. (2018); Torino.
- Industrial Hygiene Monitoring: Outdoor Workplaces. Val D’agri Oil Center Viggiano ENI S.p.A. (2018). Phoenix ESD s.r.l.
- ACGIH. TLVs® and BEIs®: Based on the Documentation of the Threshold Limit Values for Chemical Substances and Physical Agents & Biological Exposure Indices. Cincinnati, OH: ACGIH; 2018.
- United States Department of Labor. Permissible Exposure Limits. 2018. [cited 23 September 23 2018]. Available from: https://www.osha.gov/dsg/annotated-pels/tablez-1.html
- Verma DK, Johnson DM, MCLeanb JD. Benzene and Total Hydrocarbons Exposures in the Upstream Oil and Gas Industries. AIHAJ – American Industrial Hygiene Association. (2000); 61(2):255-63.
- SAG Detail. [cited 23 September 2018]. Available from: https://www.sgsgalson.com/sag-detail/?type=std&cas=NA&substance=Total Hydrocarbons.
- Indoor Air Quality Assessment. [cited 23 September 2018]. Available from: https://www.usgbc.org/credits/new-construction-commercial-interiors-core-and-shell-schools-new-construction-retail-new-c-8.
- Chen M, Lin C, Cheng L, Yang Y, Huang L, Yeh SH, Hsu H. Excess Lifetime Cancer Risk Assessment of Volatile Organic Compounds Emitted from Petrochemical Industrial Complex. Aerosol and Air Quality Research (2016); 16 (8): 1954-1966. doi:10.4209/aaqr.2015.05.0372.
- Malizia A, Gelfusa M, Ciparisse J, Rossi R, Lucaroni F, Palombi L, De Angelis D and Gaudio P - A Technical Proposal for Active Sensing Monitoring Activities in the Area of Viggiano (South of Italy) and in Rural and Urban Areas: LIDAR/DIAL Techniques to Detect the Presence of Pollutants and to Control Biomass Combustion Products Like CO or PM10 - Biomedicine & Prevention issues (2018) - vol. 1 - (154) - DOI:10.19252/00000009A.
- Palombi L, Ambrosone C, Morciano L, Buonomo E, Malizia A, Moramarco S, Cerone G, Berardi A, De Angelis D, Aniuskevich A and Lucaroni F - A New Approach to Assess the Health of Workers - Biomedicine & Prevention issues (2018) - vol. 2 - (159) - DOI:10.19252/00000009F.